
Power BI: How To Write Efficient DAX Formulas
Contents
Have you ever built a Power BI dashboard that looked great?
But then you clicked a slicer and then waited, and waited, and waited for the visuals to update?
Slow reports aren’t just inconvenient — they can frustrate stakeholders, reduce adoption, and hide valuable insights behind spinning load icons.
In Power BI, efficient DAX is the difference between a smooth, interactive experience and a dashboard that feels like it’s stuck in molasses.
Performance problems usually stem from two main causes:
- Poor data modelling that forces DAX to process more data than necessary
- Overly complex measures that add unnecessary processing steps
This article will walk you through spotting, troubleshooting, and optimizing slow DAX formulas, with practical examples, proven techniques, and best practices to help you write fast, clean, and maintainable code.
Signs Your DAX is Inefficient
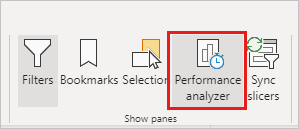
You might notice the problem when visuals take noticeably longer to load than others, or when the Performance Analyzer shows a single calculation consuming most of the execution time.
In some cases, reports may even become unresponsive when slicers or filters are applied.
These are all signs that your formulas are doing more work than necessary and could benefit from optimization.

This screenshot is from a small model, which is why the performance gap between the two measures is not significant.
From Our Power BI Courses in London:
Scenario: In a client’s sales dashboard, every time you selected a region from a slicer, the entire page froze for 15–20 seconds.
Cause: A SUMX over the raw sales table was multiplying Quantity * Price row by row every time.
Solution: We helped them pre-calculate the Line Amount in Power Query and then used a simple SUM.
Result: Visual refresh time dropped from 20 seconds to under 2!
Common Causes of Inefficient DAX
- Row-by-row evaluation on large tables – using FILTER without limiting the input table
- Unnecessary calculated columns instead of measures
- Overuse of iterators (SUMX, AVERAGEX) where SUM or AVERAGE would suffice
- Deeply nested IF statements instead of SWITCH or lookup tables
- Misuse of ALL or ALLEXCEPT triggering unnecessary full scans
Example from experience: A sales measure that originally took 12 seconds to load was scanning millions of rows unnecessarily.
By pre-aggregating the data and replacing SUMX with SUM, the calculation dropped to under a second.
How to Troubleshoot Slow DAX Formulas
When your report feels sluggish, start by running the Performance Analyzer to identify which measures are taking the most time to execute.
Insights From Our Training:
On our London course in July, we worked with a financial client working on a report with countless visuals and slicers.
To track down the issue, we used the Performance Analyzer.
They were using a KPI measure with 12 nested IF statements to handle different business rules.
The Performance Analyzer immediately showed it was the slowest measure on the page.
It is absolutely the best tool you have when it comes to tracking performance!
Once you’ve pinpointed the slow ones, break those formulas into smaller variables so you can test each component individually and see where the bottleneck lies.
It’s also important to check whether the slowdown is caused by filter context being converted to row context, as this can add unnecessary overhead.
Finally, validate your logic on a smaller dataset before applying it to your full model, this ensures your calculations are correct and easier to refine without waiting on large-scale processing.
We also have a free DAX Optimiser tool run on the site, that can optimise your formulas while teaching you best practices!
Optimization Techniques
- Replace iterators with base aggregators whenever possible
- Push heavy or repetitive calculations into Power Query for pre-computation
- Limit FILTER scope to only what’s necessary
- Use variables to avoid recalculating the same logic multiple times
- Pre-aggregate calculations in the model if used repeatedly across measures
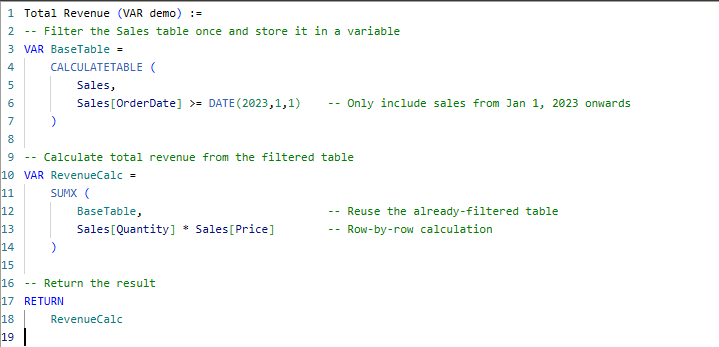
In this example, we have:
1 – Only filtered the Sales table
2 – Created a variable to hold the filtered Sales table.
3 – Referenced the filtered Sales table in a calculation.
This stops us from having to re-filter the table every time we want to reference it!
Best Practices for Writing Efficient DAX
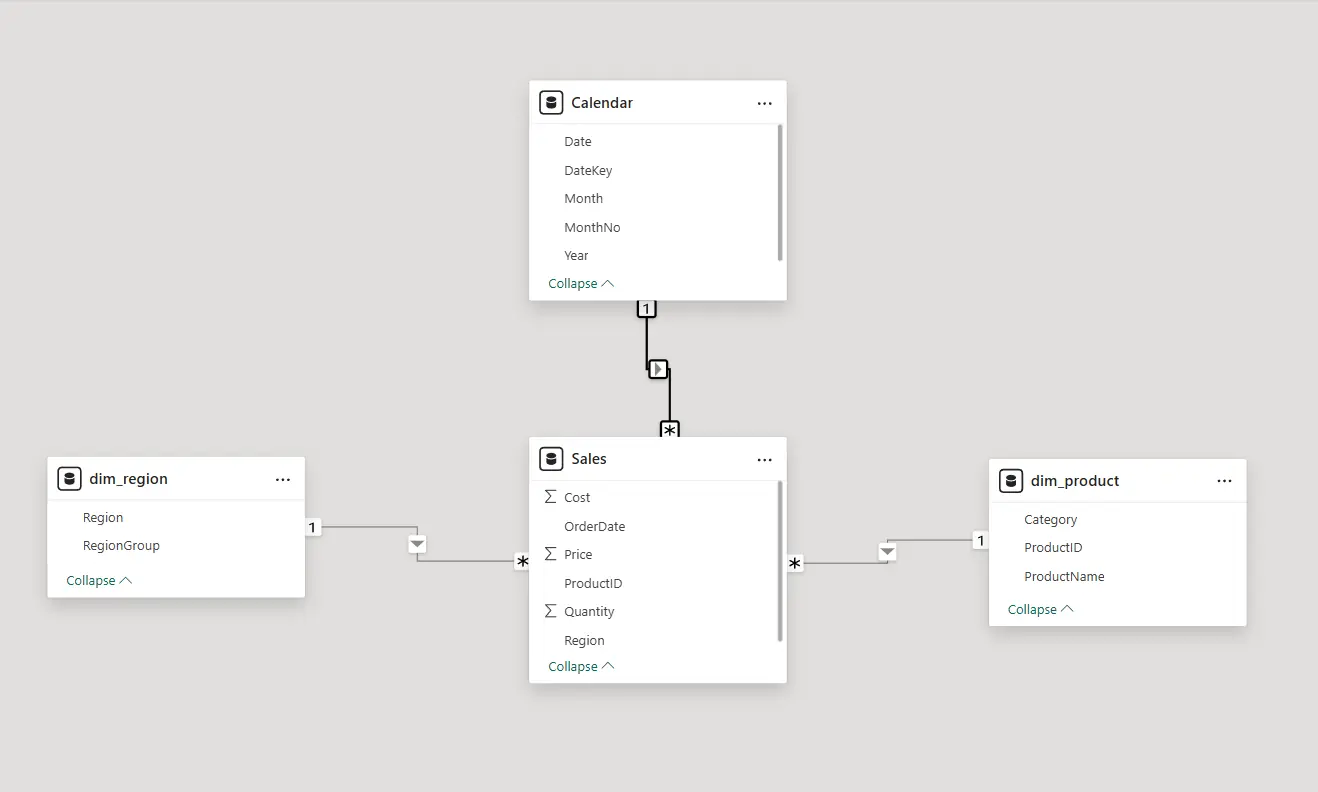
- Build a star schema with correct relationships
- Keep measures short, modular, and reusable
- Test early with large datasets to catch performance issues
- Document formulas for clarity and easier maintenance
Conclusion
Efficient DAX is less about writing short formulas and more about writing the right ones.
A clean data model, optimized logic, and regular performance testing can significantly speed up your dashboards.
Small changes like narrowing filter scope or replacing iterators can make a noticeable difference.
By making optimization a standard part of development, you ensure your reports stay fast, maintainable, and ready to deliver insights without delay.
From The Trenches:
When we work on people’s reports, optimisation is always at the top of our minds – and it should be at yours too!
We’ve seen beautifully designed dashboards fall flat simply because they take too long to respond.
All it takes is a few small DAX changes to make everything smooth!
When we work on people’s reports, optimisation is always at the top of our minds – and it should be at yours too!
We’ve seen beautifully designed dashboards fall flat simply because they take too long to respond.
All it takes is a few small DAX changes to make everything smooth!


- Facebook: https://www.facebook.com/profile.php?id=100066814899655
- X (Twitter): https://twitter.com/AcuityTraining
- LinkedIn: https://www.linkedin.com/company/acuity-training/