
Creating Organizational Charts in Power BI: A Step-by-Step Guide
Contents
Ever wished you could visualize your company’s hierarchy at a glance?
Seeing reporting lines, team structures, and department groupings in one clear view?
That’s exactly what an organizational chart in Power BI makes possible.
An organizational chart is a visual representation of reporting relationships.
They help HR teams, managers, and business leaders understand company structures and team dynamics.
While Power BI doesn’t have a built-in org chart visual, you can easily create one using custom visuals from AppSource.
Our Trainers Advice To Keep In Mind!
When we teach org charts, we always stress:
They are living tools, not one-off visuals!
Build them on clean, regularly updated data so they stay accurate as your business evolves.
Set a monthly refresh check with HR or operations to keep reporting lines current.
This prevents charts from becoming outdated slide decks and keeps them valuable!
Section 1: Setting Up Data
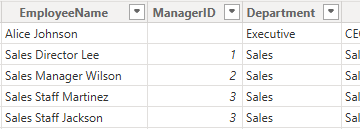
The foundation of any org chart is well-structured hierarchical data. A typical dataset should include:
- Employee ID / Name – Unique identifier for each person
- Manager ID / Name – Defines reporting lines
- Department – Groups staff into business units
- Role / Job Title – Adds context to positions
From Our Power BI Courses run in London:
We once worked with a tech company that had scaled from 80 to over 200 employees in just a year.
Leadership felt like they were flying blind, nobody had a clear picture of who reported to who anymore!
We helped their HR team build an org chart in Power BI using a simple employee/manager dataset.
Within a week, they replaced half a dozen outdated spreadsheets and slides with a live, interactive chart.
Executives could now instantly see department sizes, reporting lines, and gaps in team coverage, all in one place.
Section 2: Adding an Org Chart Visual
Since Power BI doesn’t have a native org chart, you’ll need to import a custom visual.
Steps:
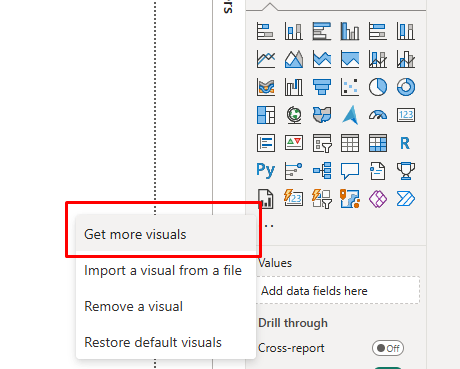
1. Go to Visualizations Pane > Get More Visuals (AppSource).
2. You will see the AppSource interface, with loads of great recommended visuals.
For us, we want to search for “Org Chart” or “Organization Chart”.
3. Click “Add” and it will directly import the visual for you!
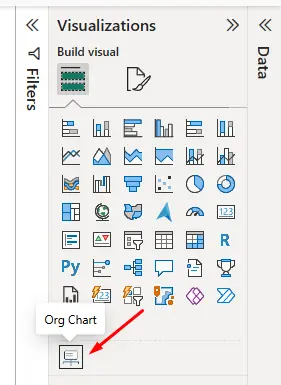
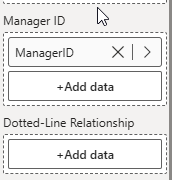
4. Click the visual, and start mapping your fields:
- Employee → Employee ID / Name
- Manager → Manager ID / Name
- Department / Role → Additional details
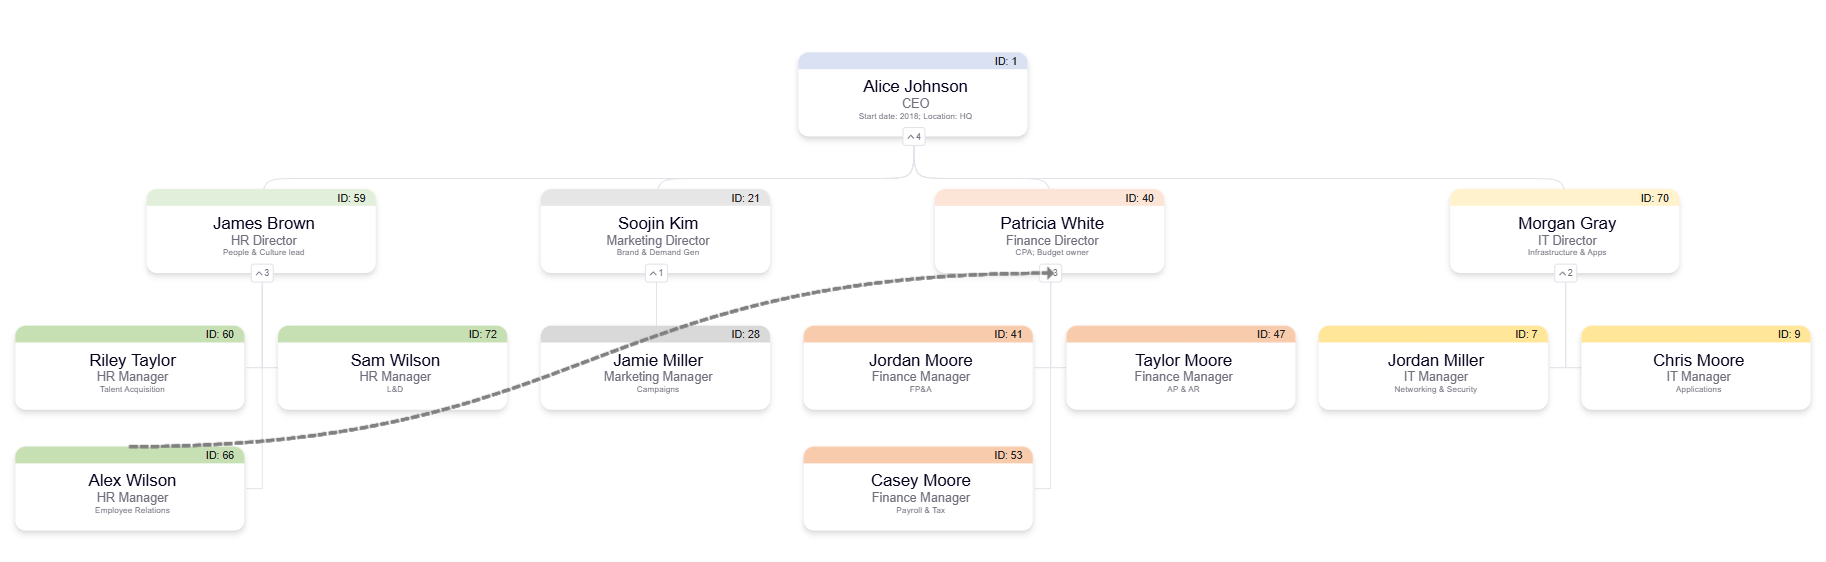
Formatting Tips:
- Use department-based colors for clarity.
- Expand / collapse features help when dealing with larger organizations.
- If you have one, use your companies custom font for the text!
Section 3: Use Cases
Organizational charts are more than just visuals; they drive practical business value:
1. Visualizing Company Structure – A clear chart helps leadership understand reporting lines across departments.
2. HR Dashboards – HR teams can filter charts by department, location, or role to support recruitment and workforce planning.
3. Project Teams & Contractors – Temporary project org charts make it easy to see who’s working together across departments.
Section 4: Limitations & Alternatives
While org chart visuals are powerful, they come with limitations:
- Row Limits – Some visuals only handle a few thousand employees.
- Performance Issues – Very large hierarchies can slow reports.
- Maintenance Overhead – Requires clean, up-to-date employee data.
Alternatives:
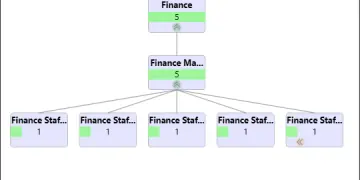
- Hierarchy Slicers + Tree Diagrams – Useful for exploring reporting lines without full org charts.
- Custom DAX Measures – Create filtered hierarchies for smaller, more focused team views.
Conclusion
Organizational charts in Power BI turn flat employee tables into interactive management tools.
They help HR, operations, and leadership teams quickly see reporting structures, spot imbalances, and plan effectively.
When applied in the right context, like workforce planning or project management dashboards, they provide far more than just a “nice-to-have” visual.
They give organizations clarity and visibility, helping leaders make faster, smarter decisions.


- Facebook: https://www.facebook.com/profile.php?id=100066814899655
- X (Twitter): https://twitter.com/AcuityTraining
- LinkedIn: https://www.linkedin.com/company/acuity-training/