
Building a London Borough Demographics Dashboard in Power BI
Contents
Demographic data plays a key role in understanding how a city like London functions.
Whether you’re working in local government, HR, or marketing, knowing how population patterns differ between boroughs helps support smarter decisions.
In this guide, you’ll learn how to create a Power BI dashboard that shows key demographic trends across London.
We’ll focus on population size, age groups, and distribution – skills that you can build further with our Power BI training courses!
Along the way, you’ll also build practical skills in working with public datasets and visuals.
Why London Demographics Matter
London is one of the most diverse cities in the world, and its boroughs vary widely.
Some areas are home to young professionals, while others have more retirees or high migration levels.
These differences impact how services are delivered and how businesses reach their audiences.
These are insights explored further in our piece on Power BI training for healthcare professionals in London, where demographic analysis is key.
Power BI allows you to take that data and turn it into clear, interactive visuals.
Step 1: Get the Right Data
Start by downloading a public dataset that breaks down demographics by borough. Two useful sources are:
- London Datastore – Borough Profiles CSV
- ONS Mid-Year Population Estimates
Look for columns such as:
- Total population
- Age distribution
- Area names
- Ethnic Distribution
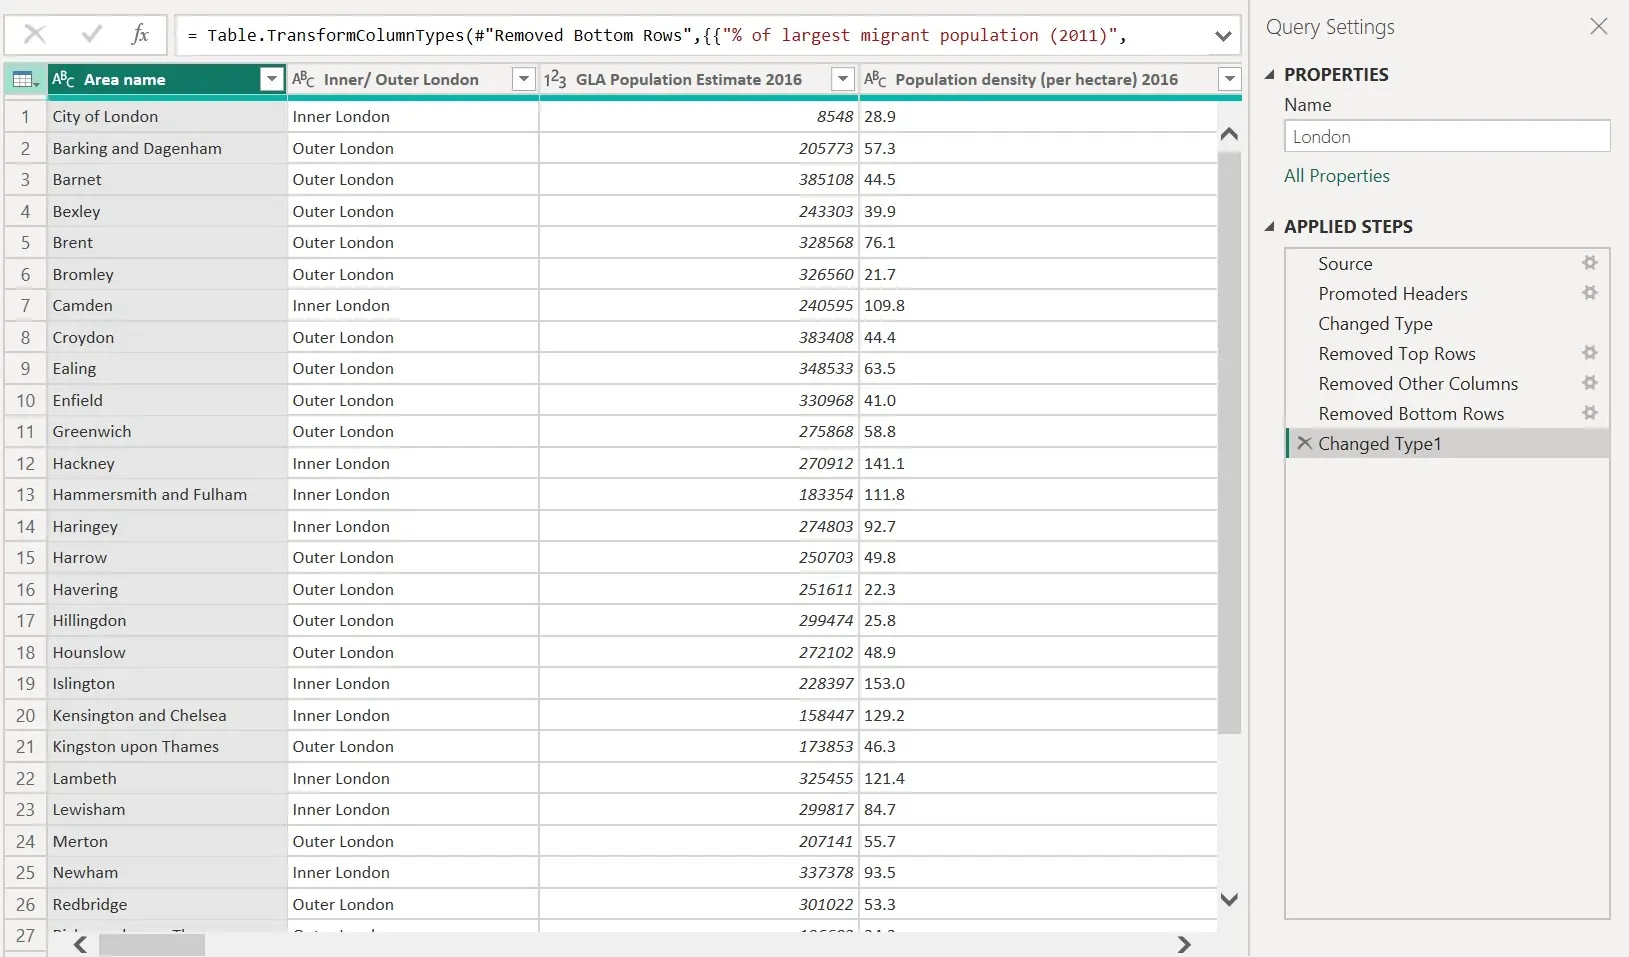
Step 2: Import and Model the Data
Import your CSV file into Power BI. You may need to clean or shape the data slightly!
Here are key setup steps:
1. Set the Borough as a geographic category
2. In Model view, set the Borough column’s data category to “Place” or “County.” This allows mapping features to work correctly.
3. Create calculated columns needed for KPIs you want to show, such as:
- Age group categories (e.g. 0–15, 16–64, 65+)
- Inner vs Outer London classification
- Custom metrics like dependency ratios
Getting the data model right from the start makes building visuals much easier.
Step 3: Build the Dashboard
Now that your data is ready, it’s time to create the visuals that will bring it to life.
The example below shows a Power BI dashboard built using demographic data from 2016 for London boroughs.
It highlights key indicators such as total population, age group distribution, and diversity levels across the city:
Providing a clear view of how London’s communities varied at that time.
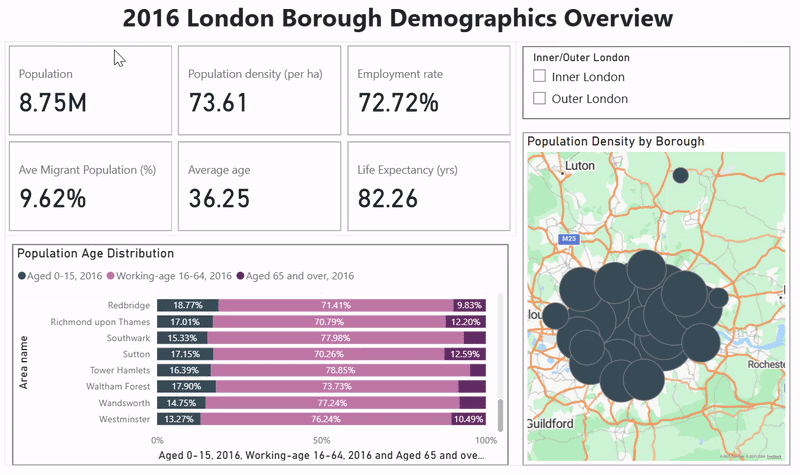
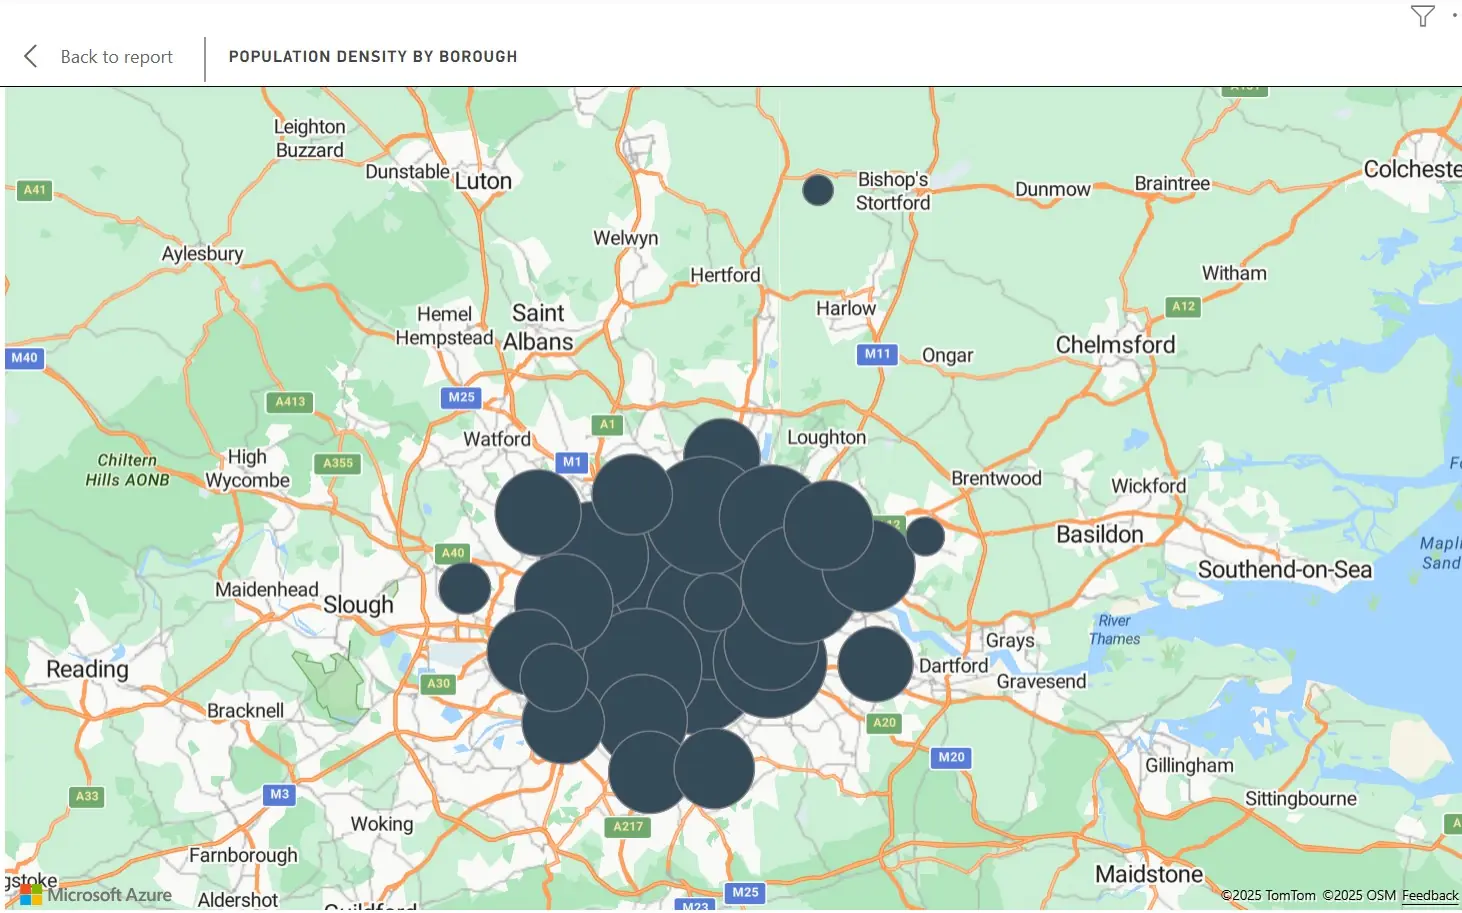
1. Map Visual
Start with a map visual using Azure Maps. Show total population or population density by borough using bubbles or colour shading.
This gives a quick, clear view of how people are distributed across London.
Trainer Insight: A common issue during training is when map visuals fail to load correctly.
This usually happens because borough names don’t match Power BI’s recognised location data.
Always check for consistent formatting and use the official borough names before building your visuals.
This usually happens because borough names don’t match Power BI’s recognised location data.
Always check for consistent formatting and use the official borough names before building your visuals.
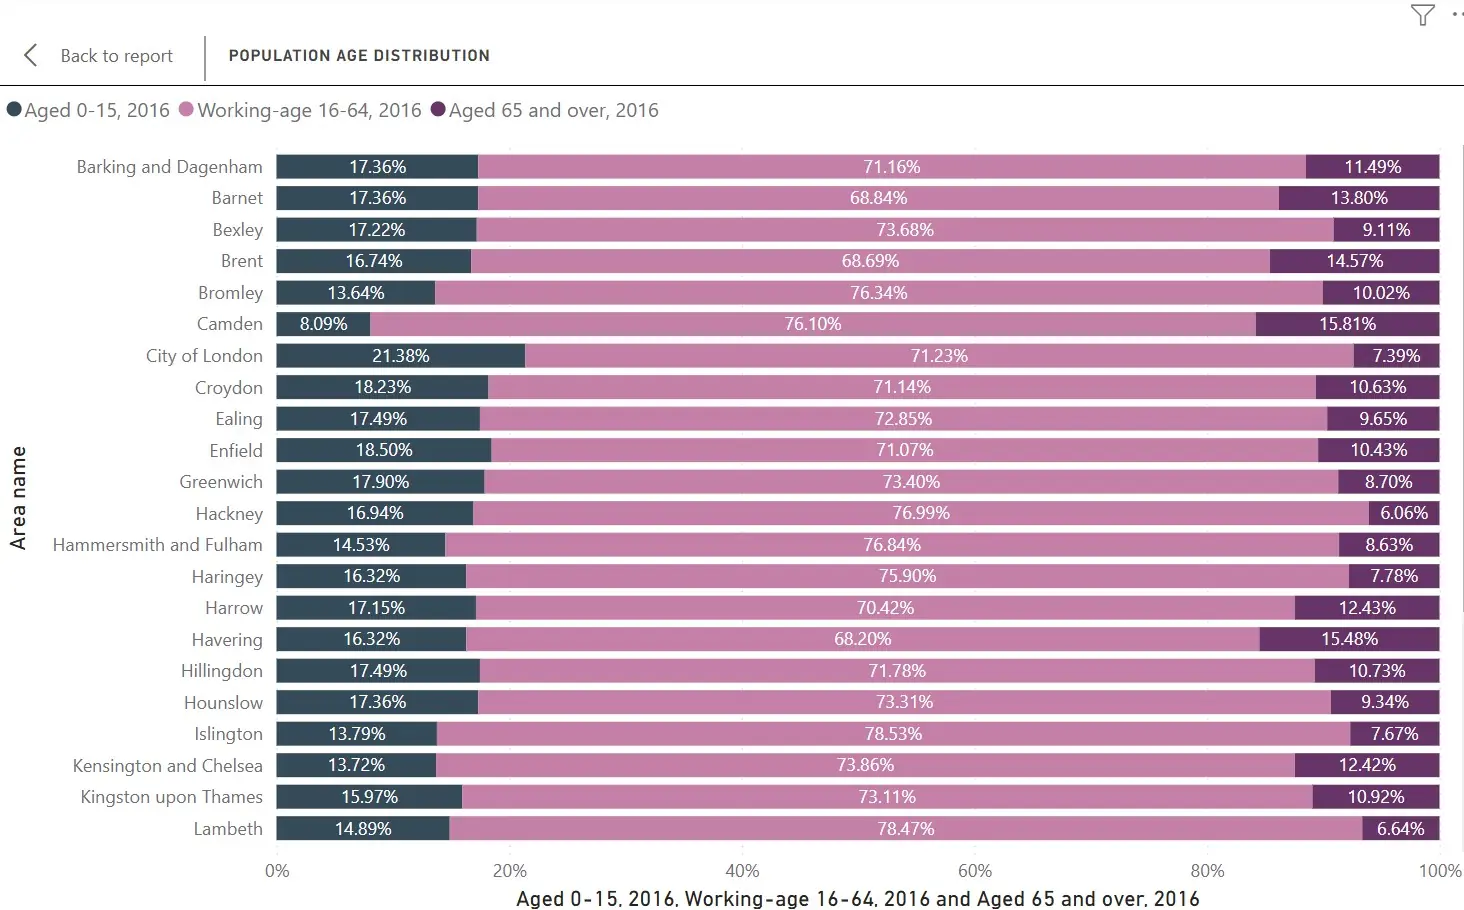
2. Age Distribution Chart
Next, use a stacked bar chart to show age breakdowns by borough.
Compare the percentage of under 16s, working-age adults, and over 65s.
Use percentage values instead of counts for easier comparison across boroughs of different sizes.
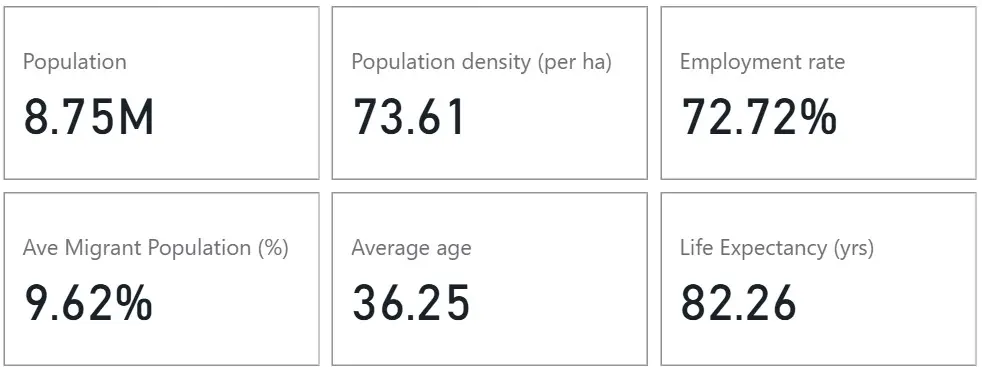
3. KPI Cards
Add KPI cards to highlight headline stats. Good examples include:
- Total population and density
- Average age and life expectancy
- Key figures such as employment rate and migrant population
KPI cards help users spot key insights at a glance.
4. Slicers
Include slicers to make the dashboard interactive.
A useful one is Inner vs Outer London, which helps users compare trends between central and outer boroughs.
Trainer Insight: In training sessions, this slicer often surprises users.
Seeing the differences between Inner and Outer boroughs reveals how varied London really is.
From Our Power BI Courses: When adding the “Inner vs Outer London” slicer, many learners are surprised by how different the two areas are.
The visual contrast between boroughs helps demonstrate how data storytelling in Power BI can highlight key urban trends at a glance.
The visual contrast between boroughs helps demonstrate how data storytelling in Power BI can highlight key urban trends at a glance.

Step 4: Use Cases for the Dashboard
This dashboard can support a wide range of decisions.
HR and Talent Planning
Companies can identify areas with younger working populations or higher employment rates.
This is particularly useful when choosing office locations or hiring strategies.
Marketing and Campaigns
Marketers can target audiences based on age and diversity.
What works in one borough may not work in another.
Public Services and Planning
Councils can use these insights to plan schools, health services, or housing – areas where visualising large-scale demographic data is essential.
Learn how data teams in the public sector are applying these techniques in our guide to Power BI training for government agencies.
For example, an area with more children may need more school places.
Common Challenges and Fixes
- Mapping not working?
Check that the borough column is set to a geographic type, and that names match official borough names. - Too much data?
Stick to a few key metrics. A focused dashboard is easier to use and more effective. - Inconsistent colours?
Use the same colour scheme across visuals. This helps users read the data more easily.
Trainer Tips: In live sessions, learners often try to include too many metrics at once.
Keeping your dashboard focused on a few KPIs -like population, age groups, and diversity.
This makes the insights clearer and the dashboard easier to use.
Keeping your dashboard focused on a few KPIs -like population, age groups, and diversity.
This makes the insights clearer and the dashboard easier to use.
Conclusion
Building a demographic dashboard in Power BI using London data is a great hands-on project. You’ll learn how to:
- Import and clean public datasets
- Work with geographic visuals
- Use slicers and KPIs to make dashboards interactive
- Tell a story using real-world data
Once you’ve built this dashboard for London, try using the same approach on other cities or datasets!
Both the Greater London Authority (GLA) and ONS offer open data for wider analysis.


- Facebook: https://www.facebook.com/profile.php?id=100066814899655
- X (Twitter): https://twitter.com/AcuityTraining
- LinkedIn: https://www.linkedin.com/company/acuity-training/