
Add Simple Borders [Quick Guide]
Contents
Unclear and poorly laid out spreadsheets are much more likely to contain errors.
Learning to present your spreadsheets clearly is extremely important.
And the larger the spreadsheet, the harder it is to control! So get it right the first time.
Formatting and presentation are covered in our Excel courses – great for presenting big spreadsheets.
Adding Your First Border
To make data easier to view or to define it, you may decide to add borders to your Excel spreadsheet.
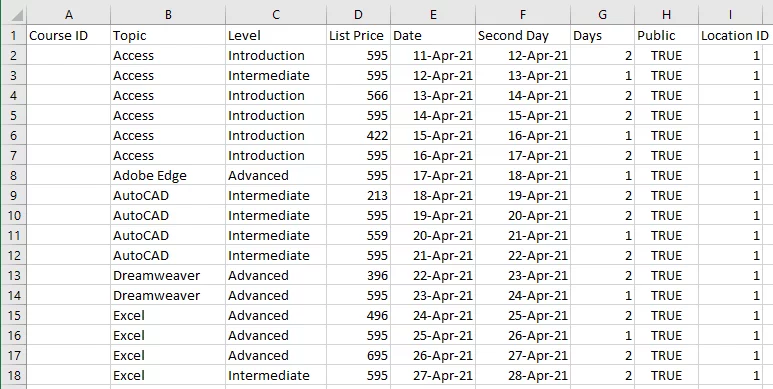
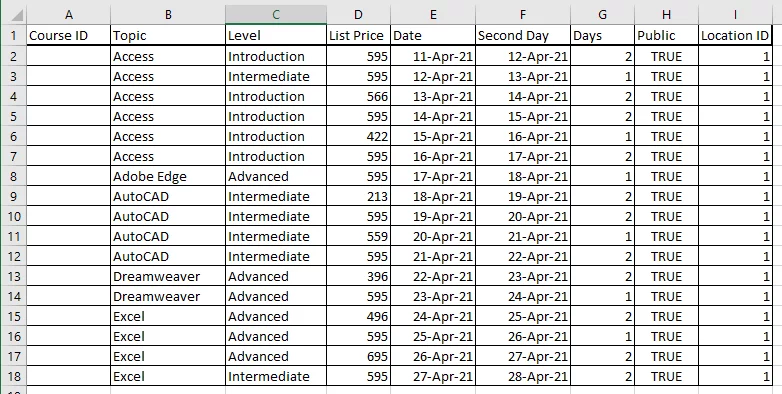
Here is an example of some of our data without any borders:
Firstly, we want to add lines around every single cell so:
Make sure that you are on the ‘Home’ tab
Highlight the area you want to apply the borders
-
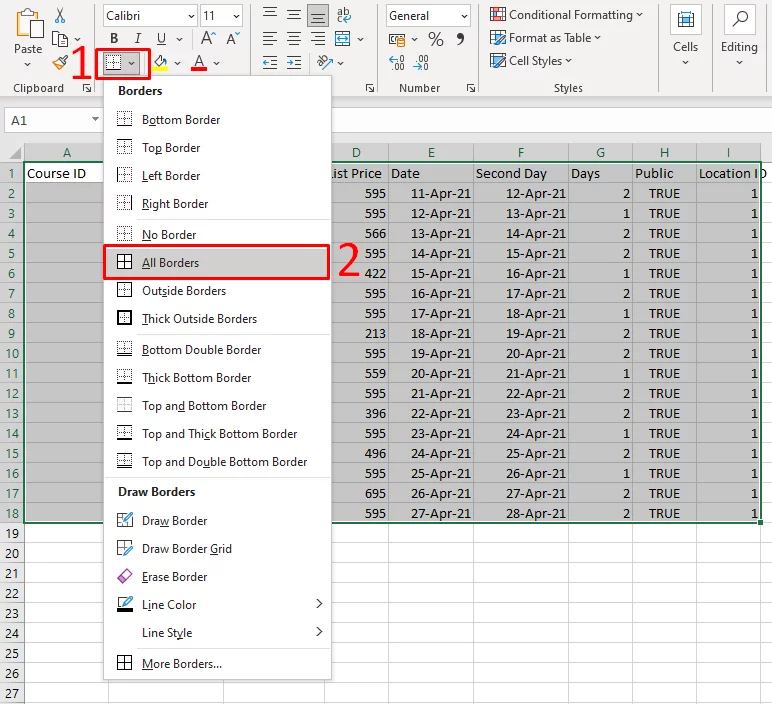
- Click the arrow on the button that looks like a little window, this is call the ‘Borders’ button, this will open up a drop-down list.
- Click on the ‘All Borders’ choice
This will then look like this:

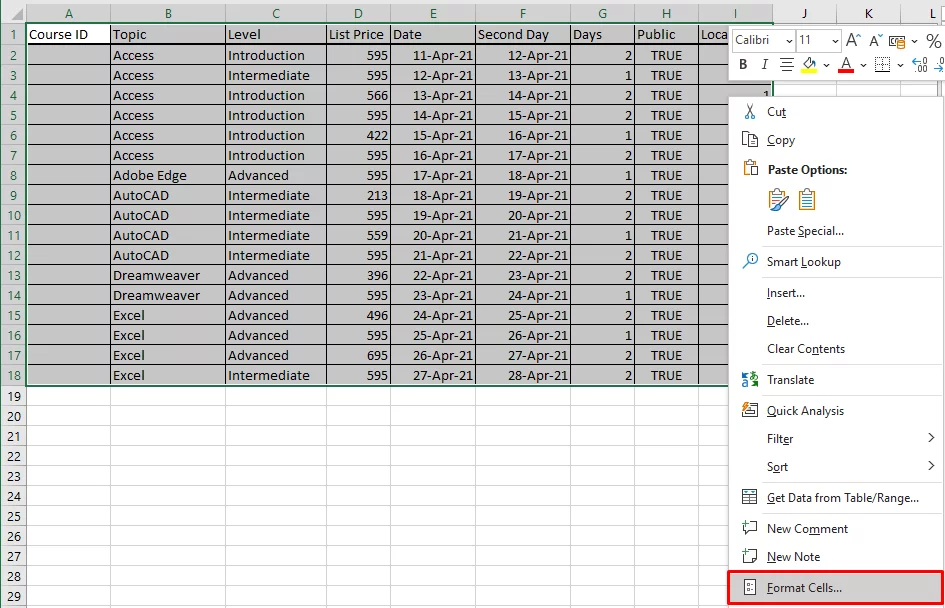
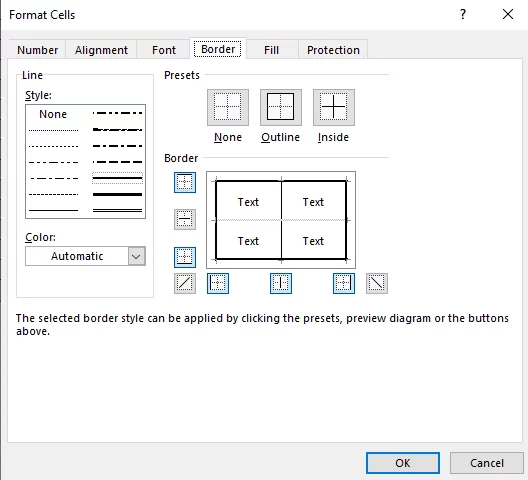
You can also get these Outlines options by right-clicking the data and opening the Dialog Box for Formatting Cells.
Picking Your Cell Borders
If you want to show up that the first row is headings, you should put a thicker line around them.
To do this, we recommend you use Thick Outside Borders.
Deciding what kind of borders are best will come up to personal preference, as well as following this general advice:
- Distinguish Headings: As stated before, Thick Outside Borders are great to make sure it’s clear which part of the data is the heading. This will also draw your reader’s eye to it.
- Highlight Special Data: Sometimes there are special outliers in your data, or specific numbers you want to draw attention to, such as an increase in profits. Here you should use borders again to highlight this data.
Special Data could also include numbers you have generated in a non-standard way, like using Excel’s random number generation!
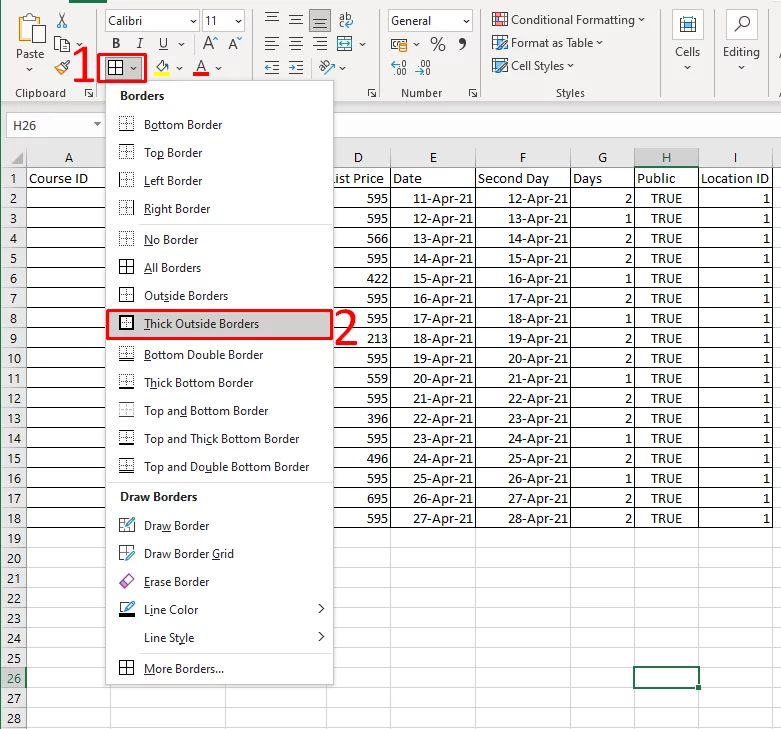
Using Thick Outside Border
First of all again highlight the cells you want the border around. Here we are using the header line.
- Click on the arrow on the ‘Borders’
- Click on the Thick Outside Border. This is purely an outer border and will not make the internal line thick.
Your spreadsheet will then look like this:
This looks better, but still not quite right! To finish it off, it needs a thick border around the complete table.
- Highlight the whole table and click on the arrow on the ‘Borders’
- Click Thick Box Border
This has now put a thicker border around the whole thing and just to finish it off I’ve made the heading text bold. This is how it will look when printed as well.

Now the data is all neat and tidy, we suggest using font formatting to help key points stand out!
Final Thoughts
Cell Borders are a great way to distinguish your data.
Good judgement on when to use specific borders will help people get through your data more easily and streamline your workflow.
Borders are a great way to, find out how to rename your Excel worksheet here.

- Facebook: https://www.facebook.com/profile.php?id=100066814899655
- X (Twitter): https://twitter.com/AcuityTraining
- LinkedIn: https://www.linkedin.com/company/acuity-training/